Multiple Choice
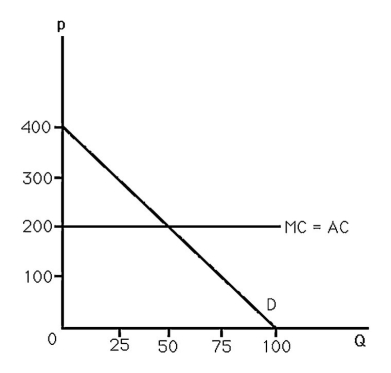
-The above figure shows the demand and cost curves facing a monopoly.If a $100 per unit tax is charged,what is the incidence of the tax on consumers?
A) 100%
B) 50%
C) 25%
D) 0%
Correct Answer:

Verified
Correct Answer:
Verified
Q64: <img src="https://d2lvgg3v3hfg70.cloudfront.net/TB6808/.jpg" alt=" -The above figure
Q65: A monopolist faces the inverse demand curve
Q66: A monopolist faces the inverse demand curve
Q67: A monopoly can be formed by a
Q68: Patents<br>A) will create a profit incentive to
Q70: If the government regulates a natural monopoly
Q71: The monopolist's marginal revenue curve<br>A) doesn't exist.<br>B)
Q72: An alternative to patent protection might be<br>A)
Q73: <img src="https://d2lvgg3v3hfg70.cloudfront.net/TB6808/.jpg" alt=" -The above figure
Q74: <img src="https://d2lvgg3v3hfg70.cloudfront.net/TB6808/.jpg" alt=" -The above figure