Multiple Choice
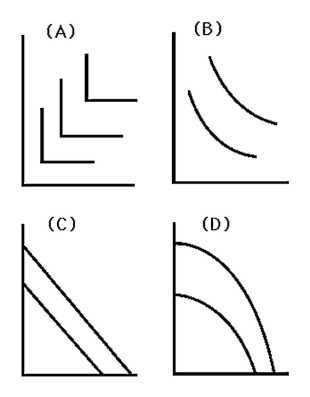
-Which graph in the above figure represents the isoquants where, as the amount of labor used increases and the amount of capital used decreases, the marginal product of labor rises (units of capital per day is on the vertical axis and units of labor per day is on the horizontal axis) ?
A) Graph A
B) Graph B
C) Graph C
D) Graph D
Correct Answer:

Verified
Correct Answer:
Verified
Q17: Changing how production is organized cannot result
Q22: If capital is fixed, but a firm
Q24: Which of the following is an output
Q28: Which of the following inputs is normally
Q29: <img src="https://d2lvgg3v3hfg70.cloudfront.net/TB8230/.jpg" alt=" -According to the
Q30: The steeper an isoquant is<br>A)the greater is
Q51: Joey cuts grass during the summer.He rents
Q60: Which of the following is least likely
Q74: Total Product is<br>A) the change in total
Q95: <img src="https://d2lvgg3v3hfg70.cloudfront.net/TB6808/.jpg" alt=" -The table in