Multiple Choice
The partially completed contingency table below shows "observed" frequencies in a sample of size 1000: 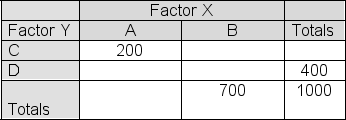 Fill in the table below with the "expected" cell frequencies if Factor X and Factor Y are independent.
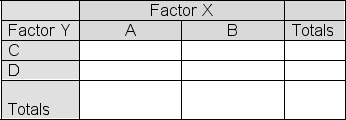 Report the value of the chi-square statistic that would be produced if we were to use the information in the tables to test the null hypothesis that the two factors shown are independent.
A) 2.71
B) 7.94
C) 14.8
D) 18.2
Correct Answer:

Verified
Correct Answer:
Verified
Q1: In a chi-square distribution with nine degrees
Q2: An NBC/Wall Street Journal poll asked
Q3: The expected frequency in a goodness of
Q4: A sample of 100 colored balls is
Q5: Economic Review reported that for 50% of
Q7: A sample of 100 colored balls is
Q8: Below is a contingency table showing the
Q9: In a chi-square test of proportion differences,
Q10: Economic Review reported that for 50% of
Q11: Samples of equal size have been selected