Multiple Choice
Below is a frequency table showing the number of new restaurants opened in the city over the past 24 months.Compute the variance of the number of openings data.Treat the data as a population. 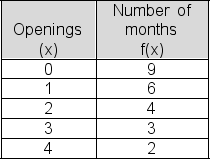
A) 1.71
B) 1.15
C) 2.58
D) 1.09
E) 2.76
Correct Answer:

Verified
Correct Answer:
Verified
Related Questions
Q137: The relative frequency of a class is
Q138: The closing share price for G.E.stock over
Q139: The is the measure of central tendency
Q140: The number of US solar energy companies
Q141: The standard deviation of a sample:<br>A)is always
Q142: The table shows the life expectancy in
Q143: Below is a table showing the number
Q144: On the horizontal axis of a bar
Q145: The waiting line of cars at In-N-Out
Q146: If a distribution has a shape that