Multiple Choice
The following chart gives the number of full years served by the first 42 presidents of the United States (up to and including George W.Bush) .What is the median number of full years served by the first 42 presidents of the United States? 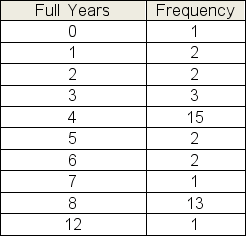
A) 2.0 years
B) 4.0 years
C) 5.2 years
D) 8.5 years
E) 6.3 years
Correct Answer:

Verified
Correct Answer:
Verified
Q55: Below is a frequency distribution table showing
Q56: Below is a table showing the ages
Q57: The table shows the phone charge for
Q58: The point for which at least half
Q59: Turcott Roof and Deck has 130 jobs
Q61: Which of the following best describes a
Q62: When working with grouped data, classes should
Q63: The number of days required per audit
Q64: In a relative frequency distribution, is substituted
Q65: The table shows the GDP per capita