Multiple Choice
Below is a frequency distribution table showing the number of cars sold by the 30 sales reps at Hermiston Kia during the past month.You plan to show the data in a "greater than or equal to" cumulative relative frequency table.What cumulative relative frequency would you show for 1 car? 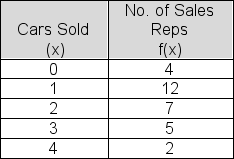
A) .533
B) .867
C) .767
D) .467
E) .133
Correct Answer:

Verified
Correct Answer:
Verified
Q50: The table shows the phone charge for
Q51: For a sample of 10 days, Harkin
Q52: The age distribution of consumers who identify
Q53: Below is a table showing the number
Q54: In a recent survey, 75 college students
Q56: Below is a table showing the ages
Q57: The table shows the phone charge for
Q58: The point for which at least half
Q59: Turcott Roof and Deck has 130 jobs
Q60: The following chart gives the number of