Multiple Choice
The graph shown displays the cost and revenue curves associated with a monopolistically competitive firm. 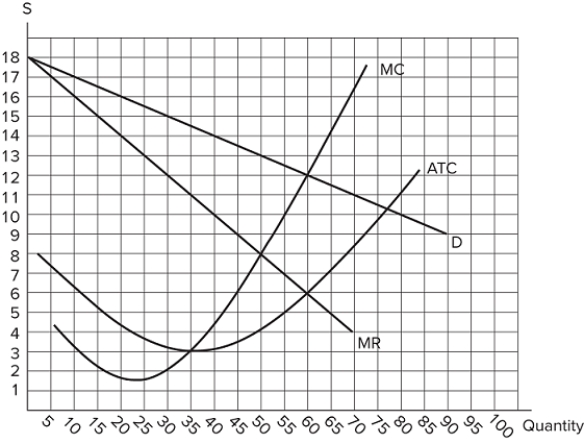 How much profit does this firm earn?
A) $360
B) $450
C) $200
D) $250
Correct Answer:

Verified
Correct Answer:
Verified
Related Questions
Q2: If the demand curve for a firm
Q3: A company that spends a lot of
Q4: Like the monopolist, the monopolistically competitive firm:<br>A)faces
Q5: Firms are incentivized to enter a monopolistically
Q6: Companies that support advertising often believe that
Q8: Innovation gives firms in a monopolistically competitive
Q9: The graph shown displays the cost and
Q10: If a government were to regulate a
Q11: An oligopoly with two firms is known
Q12: A market that consists of only a