Multiple Choice
The graph shown displays the cost and revenue curves associated with a monopolistically competitive firm. 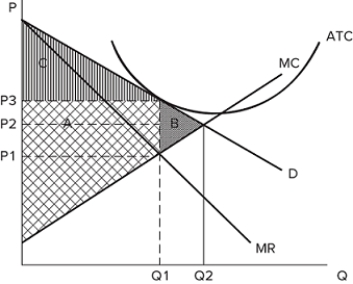 If the firm is producing Q1 and charging P3, it is likely:
A) earning positive economic profits.
B) earning negative economic profits.
C) in long run equilibrium.
D) All of these are true.
Correct Answer:

Verified
Correct Answer:
Verified
Q4: Like the monopolist, the monopolistically competitive firm:<br>A)faces
Q5: Firms are incentivized to enter a monopolistically
Q6: Companies that support advertising often believe that
Q7: The graph shown displays the cost and
Q8: Innovation gives firms in a monopolistically competitive
Q10: If a government were to regulate a
Q11: An oligopoly with two firms is known
Q12: A market that consists of only a
Q13: A company with a strong brand identity:<br>A)conveys
Q14: What is the primary difference between a