menu-iconExamlexExamLexServices

Discover

Ask a Question
  1. All Topics
  2. Topic
    Business
  3. Study Set
    Microeconomics Study Set 43
  4. Exam
    Exam 15: Monopolistic Competition and Oligopoly
  5. Question
    The Graph Shown Displays the Cost and Revenue Curves Associated
Solved

The Graph Shown Displays the Cost and Revenue Curves Associated

Question 27

Question 27

Multiple Choice

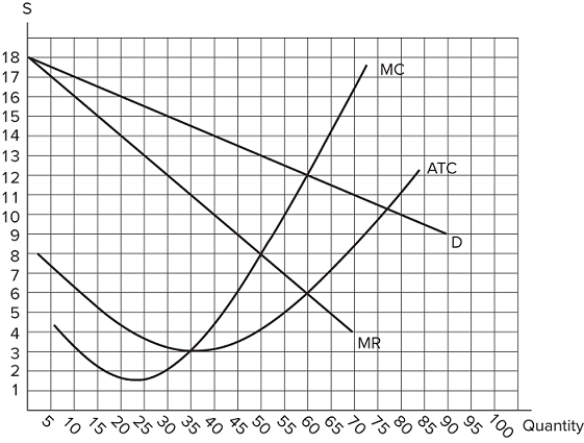
The graph shown displays the cost and revenue curves associated with a monopolistically competitive firm. The graph shown displays the cost and revenue curves associated with a monopolistically competitive firm.   What price will the firm charge? A) $3 B) $8 C) $12 D) $13 What price will the firm charge?

A) $3
B) $8
C) $12
D) $13

Correct Answer:

verifed

Verified

Unlock this answer now
Get Access to more Verified Answers free of charge

Related Questions

Q22: Two firms in an oligopolistic market, Firm

Q23: Collusion is:<br>A)buyers acting in unison against a

Q24: Suppose Coca-Cola controls 80 percent of the

Q25: If a government were to regulate a

Q26: The graph shown displays the cost and

Q28: Which of the following would cause a

Q29: The goods or services that firms in

Q30: A group of firms who collude to

Q31: Standardized products can appear:<br>A)only in perfectly competitive

Q32: In the long run, firms in a

Examlex

ExamLex

About UsContact UsPerks CenterHomeschoolingTest Prep

Work With Us

Campus RepresentativeInfluencers

Links

FaqPricingChrome Extension

Download The App

Get App StoreGet Google Play

Policies

Privacy PolicyTerms of ServiceHonor CodeCommunity Guidelines

Scan To Download

qr-code

Copyright © (2025) ExamLex LLC.

Privacy PolicyTerms Of ServiceHonor CodeCommunity Guidelines