Multiple Choice
The graph shown displays the cost and revenue curves associated with a monopolistically competitive firm. 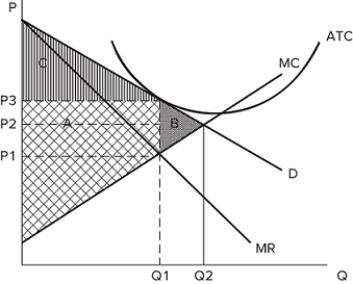 Producing Q2 and charging P2:
A) represents the perfectly competitive outcome.
B) is an efficient outcome.
C) is an outcome that eliminates deadweight loss.
D) All of these are true.
Correct Answer:

Verified
Correct Answer:
Verified
Q21: What signal does a company give by
Q22: Two firms in an oligopolistic market, Firm
Q23: Collusion is:<br>A)buyers acting in unison against a
Q24: Suppose Coca-Cola controls 80 percent of the
Q25: If a government were to regulate a
Q27: The graph shown displays the cost and
Q28: Which of the following would cause a
Q29: The goods or services that firms in
Q30: A group of firms who collude to
Q31: Standardized products can appear:<br>A)only in perfectly competitive