Multiple Choice
The eight climographs show yearly temperature (line graph and left vertical axis) and precipitation (bar graph and right vertical axis) averages for each month for some locations on Earth.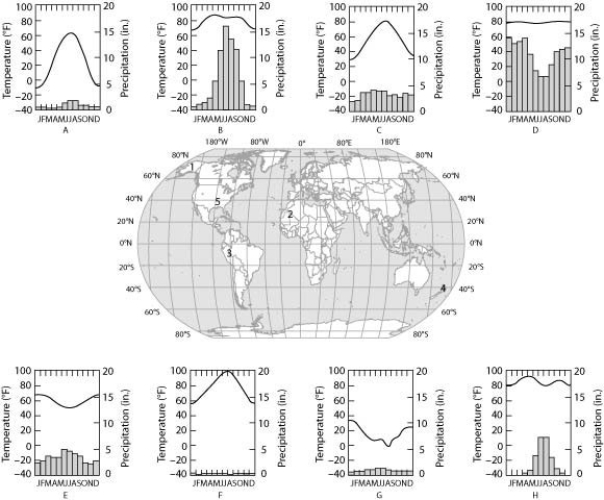
Which climograph shows the climate for location 3?
A) B
B) C
C) D
D) E
Correct Answer:

Verified
Correct Answer:
Verified
Related Questions
Q8: Wetlands are standing bodies of freshwater, just
Q13: Which of the following types of organisms
Q26: If you are interested in observing a
Q27: Which lake zone would be absent in
Q33: As climate changes because of global warming,
Q39: Which of the following statements can be
Q51: Organisms evolve over generations to become adapted
Q54: Which of the following examples demonstrate an
Q58: Use the following figures to answer the
Q60: Use the following figures to answer the