Multiple Choice
Use the graph to answer the following question.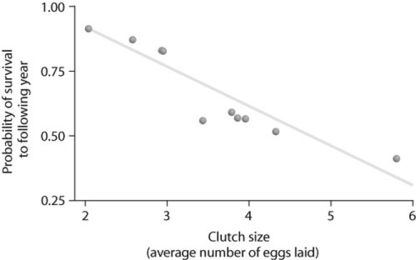
Looking at the data in the figure, what can be said about survival and clutch size?
A) Animals with low survival tend to have smaller clutch sizes.
B) Large clutch size correlates with low survival.
C) Animals with high survival tend to have medium-sized clutches.
D) Probability of survivorship does not correlate with clutch size.
Correct Answer:

Verified
Correct Answer:
Verified
Q14: A population of white-footed mice becomes severely
Q17: Use the survivorship curves in the figure
Q20: Use the figure to answer the following
Q22: Which pair of terms most accurately describes
Q23: Use the figure to answer the following
Q25: Which of the following statements regarding the
Q27: Suppose researchers marked 800 turtles and later
Q41: Long-term studies of Belding's ground squirrels show
Q44: Scientific study of the population cycles of
Q62: Which of the following causes populations to