Multiple Choice
Use the figure to answer the following question.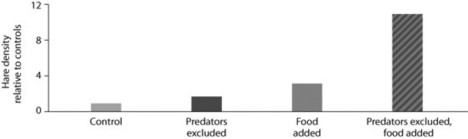
Looking at the data in the figure from the hare/lynx experiment, what conclusion(s) can you draw?
I.Food is a factor in controlling hare population size.
II.Excluding lynx is a factor in controlling hare population size.
III.The effect of excluding predators and adding food in the same experiment is greater than the sum of excluding lynx alone plus adding food alone.
A) only I
B) only II
C) only III
D) I, II, and III
Correct Answer:

Verified
Correct Answer:
Verified
Q14: A population of white-footed mice becomes severely
Q15: Which statements about K are correct?<br>I. K
Q17: Use the survivorship curves in the figure
Q19: Use the graph to answer the following
Q22: Which pair of terms most accurately describes
Q23: Use the figure to answer the following
Q25: Which of the following statements regarding the
Q27: Suppose researchers marked 800 turtles and later
Q41: Long-term studies of Belding's ground squirrels show
Q44: Scientific study of the population cycles of