Multiple Choice
Use the following figure to answer the question.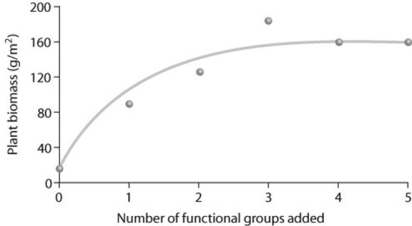
Examine the figure and consider this hypothesis: Plant biomass increases with species richness. Functional groups are categories of plants each containing numerous species, such as grasses and wildflowers, or trees and shrubs. In looking at the data in the figure, how would you relate it to this hypothesis? The hypothesis is ________.
A) partially supported
B) supported
C) rejected
D) neither rejected nor supported
Correct Answer:

Verified
Correct Answer:
Verified
Q7: Which of the following statements regarding extinction
Q16: Burning fossil fuels releases oxides of sulfur
Q22: Use the graphs to answer the question.<br><img
Q24: Erwin and Scott used an insecticidal fog
Q30: Loss of biodiversity matters not only with
Q36: Which of the following statements is accurate
Q41: A land developer and several ecologists are
Q46: The main goal of sustainable development is
Q48: The primary difference between the small-population approach
Q63: Movement corridors can be harmful to certain