Multiple Choice
Use the graphs to answer the question.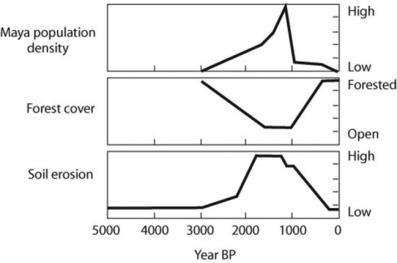
Archeological, fossil, and geological data provide information on the Mayan populations and their environment in Mexico, in the Caribbean state of Yucatán. The graphs depict population size, percentage of the land that was forested, and the amount of soil erosion. Based on the figure, what can you conclude about the history of land use in the southern Yucatán?
A) Massive soil erosion caused the Mayan population to crash.
B) Reduction in forest cover caused the Mayan population to crash.
C) As Mayan population increased, deforestation increased, probably leading to increased soil erosion.
D) This Mayan population practiced sustainable development.
Correct Answer:

Verified
Correct Answer:
Verified
Q7: Which of the following statements regarding extinction
Q16: Burning fossil fuels releases oxides of sulfur
Q18: The main cause of the increase in
Q20: Use the following figure to answer the
Q24: Erwin and Scott used an insecticidal fog
Q30: Loss of biodiversity matters not only with
Q41: A land developer and several ecologists are
Q45: Which of the following factors could cause
Q46: The main goal of sustainable development is
Q48: The primary difference between the small-population approach