Multiple Choice
The sensitivity graph of a project is presented below: 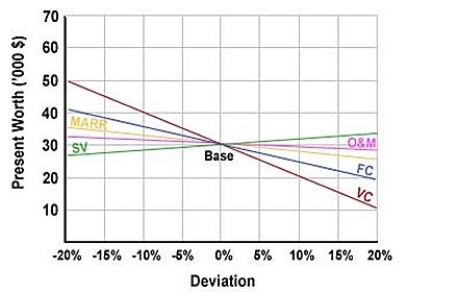 What is the least sensitive input of the project?
A) MARR
B) SV
C) FC
D) VC
E) O&M
Correct Answer:

Verified
Correct Answer:
Verified
Related Questions
Q19: A new technological line to produce shoes
Q20: In a sensitivity graph that examines the
Q21: Describe the backward induction procedure used in
Q22: Graphically, the break-even value for any one
Q23: The host of a TV show offers
Q25: A pie company has two employees who
Q26: The probability of heavy traffic on a
Q27: The decision tree of a project is
Q28: The slope of a sensitivity graph of
Q29: A graphical representation of the logical structure