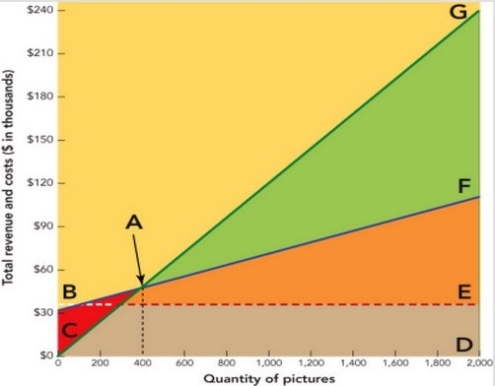
menu-iconExamlexExamLexServices

Discover

Ask a Question
  1. All Topics
  2. Topic
    Business
  3. Study Set
    Marketing The Core Study Set 5
  4. Exam
    Exam 11: Pricing Products and Services
  5. Question
    Figure 11-6a -In the Break-Even Chart in Figure 11-7a, the Triangular Area
Solved

Figure 11-6a -In the Break-Even Chart in Figure 11-7a, the Triangular Area

Question 346

Question 346

Multiple Choice

  Figure 11-6a -In the break-even chart in Figure 11-7a, the triangular area FBE represents the firm's A)  fixed costs. B)  break-even point. C)  variable costs. D)  profit. E)  total revenue. Figure 11-6a
-In the break-even chart in Figure 11-7a, the triangular area FBE represents the firm's


A) fixed costs.
B) break-even point.
C) variable costs.
D) profit.
E) total revenue.

Correct Answer:

verifed

Verified

Unlock this answer now
Get Access to more Verified Answers free of charge

Related Questions

Q14: When estimating demand, price is not the

Q116: Which of the following statements regarding a

Q122: Price elasticity of demand (E)is expressed as

Q208: The sum of the expenses of a

Q230: Unit volume as a pricing objective refers

Q236: A single jar of original formula Carmex

Q270: A custom tailor wishes to use target

Q342: <img src="https://d2lvgg3v3hfg70.cloudfront.net/TB8552/.jpg" alt=" Figure 11-7 -Suppose

Q343: According to the textbook, clothing manufacturer Christian

Q347: Mike Morgan, a sales representative for a

Examlex

ExamLex

About UsContact UsPerks CenterHomeschoolingTest Prep

Work With Us

Campus RepresentativeInfluencers

Links

FaqPricingChrome Extension

Download The App

Get App StoreGet Google Play

Policies

Privacy PolicyTerms of ServiceHonor CodeCommunity Guidelines

Scan To Download

qr-code

Copyright © (2025) ExamLex LLC.

Privacy PolicyTerms Of ServiceHonor CodeCommunity Guidelines