Multiple Choice
Figure 11-3
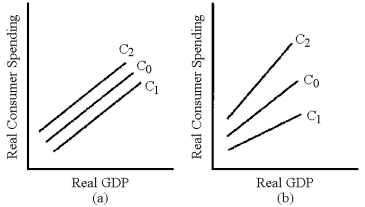
-In Figure 11-3, which line represents the change in the consumption schedule caused by a cut in fixed taxes?
A) C₁ in graph (a)
B) C₂ in graph (a)
C) C₁ in graph (b)
D) C₂ in graph (b)
Correct Answer:

Verified
Correct Answer:
Verified
Q23: Transfer payments exactly replace the income lost
Q34: Why does the numerical value of the
Q61: Policy makers and citizens who want to
Q90: Federal budget deficits are often increased by
Q113: If the Bush tax cuts were allowed
Q127: Compared to an economy's self-correcting mechanism, active
Q137: One objection to supply-side tax cuts is
Q153: To eliminate an inflationary gap, the aggregate
Q173: Figure 11-2<br> <img src="https://d2lvgg3v3hfg70.cloudfront.net/TB8592/.jpg" alt="Figure 11-2
Q196: One of the practical issues in the