Multiple Choice
Figure 11-2
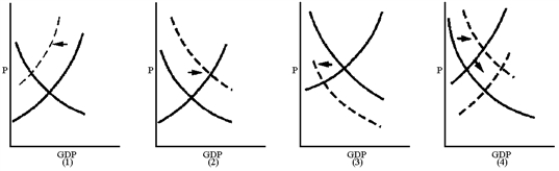
-Which graph in Figure 11-2 best reflects a Keynesian view of the impact of a $500-per-person tax cut?
A) 1
B) 2
C) 3
D) 4
Correct Answer:

Verified
Correct Answer:
Verified
Q40: Why does a tax change affect aggregate
Q168: When we add a personal income tax
Q169: If a state government reduces property taxes
Q171: Expansionary fiscal policy can cause a rise
Q172: In the determination of disposable income, transfer
Q174: Figure 11-3<br> <img src="https://d2lvgg3v3hfg70.cloudfront.net/TB8592/.jpg" alt="Figure 11-3
Q175: Critics of supply-side economics argue that a
Q176: Figure 11-3<br> <img src="https://d2lvgg3v3hfg70.cloudfront.net/TB8592/.jpg" alt="Figure 11-3
Q177: Government purchases have the same multiplier effect
Q178: Why did President George W.Bush feel the