menu-iconExamlexExamLexServices

Discover

Ask a Question
  1. All Topics
  2. Topic
    Business
  3. Study Set
    Microeconomics Study Set 46
  4. Exam
    Exam 2: Supply and Demand
  5. Question
    (Figure: Price and Quantity of Turkeys I) Mathematically, the Demand
Solved

(Figure: Price and Quantity of Turkeys I) Mathematically, the Demand

Question 1

Question 1

Multiple Choice

(Figure: Price and Quantity of Turkeys I) Mathematically, the demand curve D1 is described by this equation:
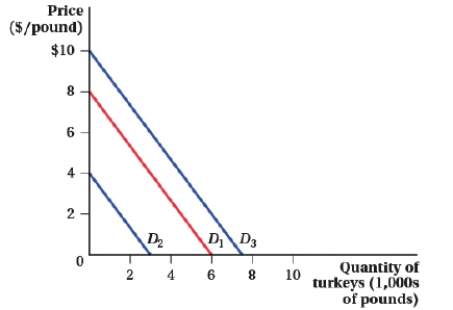
 (Figure: Price and Quantity of Turkeys I)  Mathematically, the demand curve D<sub>1</sub> is described by this equation:   A)  Q = 0.75 - P B)  Q = 6 - 0.75P C)  Q = 8 - 1.33P D)  P = 6 - 8P


A) Q = 0.75 - P
B) Q = 6 - 0.75P
C) Q = 8 - 1.33P
D) P = 6 - 8P

Correct Answer:

verifed

Verified

Related Questions

Q2: Determine the equation for both normal and

Q3: In the standard model, we expect the

Q4: Assume that the elasticity of supply is

Q5: In the market for good X, demand

Q6: Suppose that the demand and supply curves

Q7: Suppose that the extended supply curve for

Q8: Given the information in the associated graph,

Q9: Suppose that the supply of oil to

Q10: Suppose that watermelon, with price P<sub>W</sub>, and

Q11: Suppose that the market demand curve for

Examlex

ExamLex

About UsContact UsPerks CenterHomeschoolingTest Prep

Work With Us

Campus RepresentativeInfluencers

Links

FaqPricingChrome Extension

Download The App

Get App StoreGet Google Play

Policies

Privacy PolicyTerms of ServiceHonor CodeCommunity Guidelines

Scan To Download

qr-code

Copyright © (2025) ExamLex LLC.

Privacy PolicyTerms Of ServiceHonor CodeCommunity Guidelines