Multiple Choice
(Figure: Marginal Productivity of Apple Pickers I) Assume that the marginal productivity of apple pickers has increased. Which graph best illustrates this change? 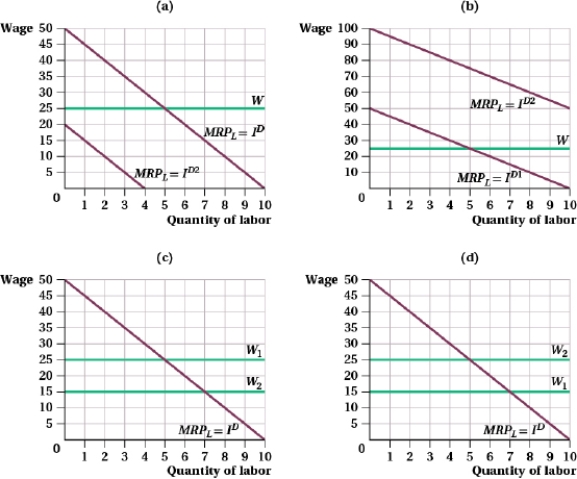
A) (a)
B) (b)
C) (c)
D) (d)
Correct Answer:

Verified
Correct Answer:
Verified
Related Questions
Q2: (Figure: Marginal Productivity of Apple Pickers I)
Q3: A firm sells bagels for 50 cents
Q4: (Figure: Labor Union Wages II) The figure
Q5: (Table: Short-run Production Function I) The table
Q6: Suppose the demand faced by a labor
Q8: Table (Baristas Labor I). Suppose that the
Q9: (Table: Short-run Production Function I) The table
Q10: Table (Baristas Labor I). Suppose that the
Q11: The government offers subsidies to homeowners for
Q12: (Figure: Budget Constraints and Indifference Curves I)