Multiple Choice
(Figure: Marginal Productivity of Apple Pickers I) Assume that there is a decrease in the wage paid to apple pickers. Which graph best illustrates this change? 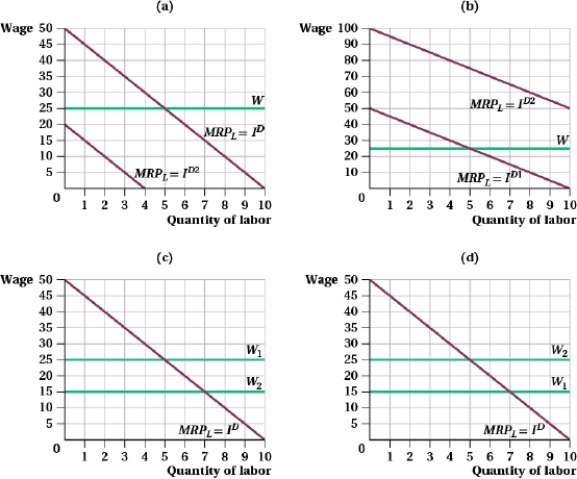
A) (a)
B) (b)
C) (c)
D) (d)
Correct Answer:

Verified
Correct Answer:
Verified
Related Questions
Q1: A pizza shop's marginal product of labor,
Q3: A firm sells bagels for 50 cents
Q4: (Figure: Labor Union Wages II) The figure
Q5: (Table: Short-run Production Function I) The table
Q6: Suppose the demand faced by a labor
Q7: (Figure: Marginal Productivity of Apple Pickers I)
Q8: Table (Baristas Labor I). Suppose that the
Q9: (Table: Short-run Production Function I) The table
Q10: Table (Baristas Labor I). Suppose that the
Q11: The government offers subsidies to homeowners for