Multiple Choice
(Table: Labor Hours Supplied I) The table shows the number of labor hours supplied per worker for various hourly wage rates. 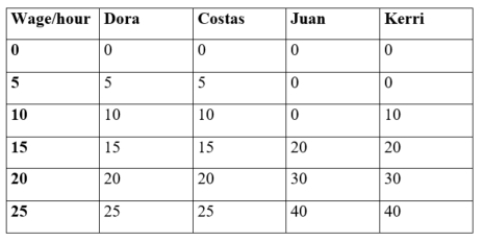 The correct market-level labor supply curve is:
A) 
B) 
C) 
D) 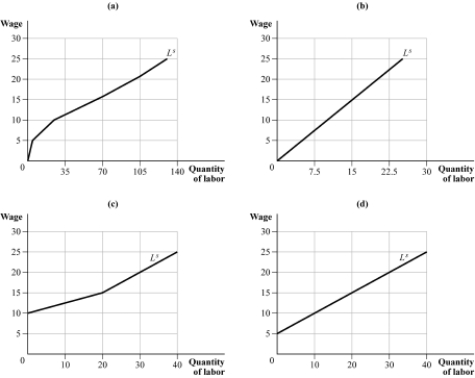
Correct Answer:

Verified
Correct Answer:
Verified
Related Questions
Q10: Table (Baristas Labor I). Suppose that the
Q11: The government offers subsidies to homeowners for
Q12: (Figure: Budget Constraints and Indifference Curves I)
Q13: (Figure: Marginal Productivity of Apple Pickers I)
Q14: If MRP<sub>L</sub> = W, then the firm:<br>A)
Q16: (Figure: Labor Union Wages I) The figure
Q17: A union faces a labor demand curve
Q18: If a monopsony faces an elasticity of
Q19: A pizza shop's marginal product of labor,
Q20: (Figure: Budget Constraint I) If Aleksandra was