Multiple Choice
(Figure: Marginal Productivity of Apple Pickers I) There is a decrease in total factor productivity. Which graph best illustrates this change? 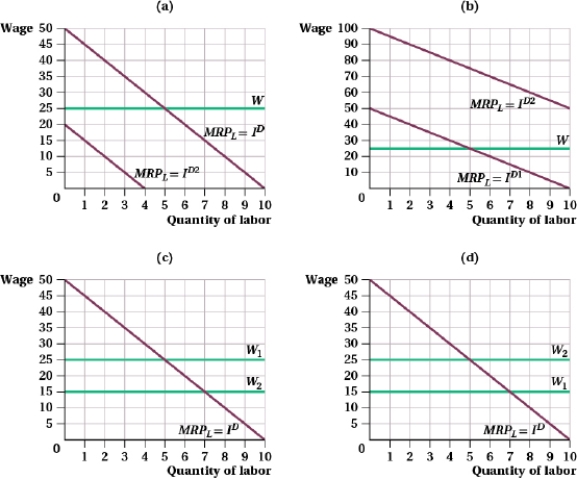
A) (a)
B) (b)
C) (c)
D) (d)
Correct Answer:

Verified
Correct Answer:
Verified
Related Questions
Q8: Table (Baristas Labor I). Suppose that the
Q9: (Table: Short-run Production Function I) The table
Q10: Table (Baristas Labor I). Suppose that the
Q11: The government offers subsidies to homeowners for
Q12: (Figure: Budget Constraints and Indifference Curves I)
Q14: If MRP<sub>L</sub> = W, then the firm:<br>A)
Q15: (Table: Labor Hours Supplied I) The table
Q16: (Figure: Labor Union Wages I) The figure
Q17: A union faces a labor demand curve
Q18: If a monopsony faces an elasticity of