menu-iconExamlexExamLexServices

Discover

Ask a Question
  1. All Topics
  2. Topic
    Business
  3. Study Set
    Microeconomics Study Set 46
  4. Exam
    Exam 11: Imperfect Competition
  5. Question
    (Figure: Market Demand Curve I) the Graph Shows the Market
Solved

(Figure: Market Demand Curve I) the Graph Shows the Market

Question 41

Question 41

Multiple Choice

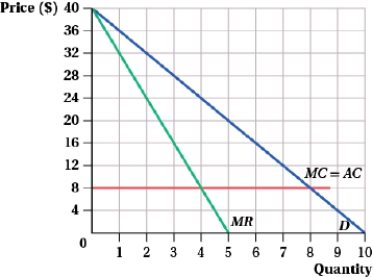
(Figure: Market Demand Curve I) The graph shows the market demand curve. (Figure: Market Demand Curve I)  The graph shows the market demand curve.   The equilibrium market quantity in a two-firm cartel is ____. A)  8 B)  6 C)  5.34 D)  4 The equilibrium market quantity in a two-firm cartel is ____.

A) 8
B) 6
C) 5.34
D) 4

Correct Answer:

verifed

Verified

Unlock this answer now
Get Access to more Verified Answers free of charge

Related Questions

Q36: Consider the following information:<br>Inverse market demand: P

Q37: (Table: Gascolator Producers I) Banner and Sense

Q38: (Table: Gascolator Producers I) Banner and Sense

Q39: (Figure: Market Demand Curve I) The graph

Q40: The inverse demand for tacos is given

Q42: Taggart Express operates in a monopolistically competitive

Q43: Two companies are the only snowplow merchants

Q44: Suppose that two firms are engaged in

Q45: The inverse demand for designer blankets is

Q46: Consider two firms engaged in Bertrand competition

Examlex

ExamLex

About UsContact UsPerks CenterHomeschoolingTest Prep

Work With Us

Campus RepresentativeInfluencers

Links

FaqPricingChrome Extension

Download The App

Get App StoreGet Google Play

Policies

Privacy PolicyTerms of ServiceHonor CodeCommunity Guidelines

Scan To Download

qr-code

Copyright © (2025) ExamLex LLC.

Privacy PolicyTerms Of ServiceHonor CodeCommunity Guidelines