Multiple Choice
(Figure: Market Demand Curve I) The graph shows the market demand curve. 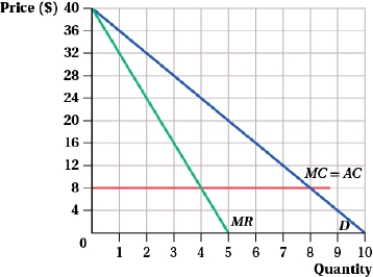 The equilibrium price in a two-firm cartel is $____.
A) 24
B) 18.64
C) 12
D) 8
Correct Answer:

Verified
Correct Answer:
Verified
Related Questions
Q34: Two firms are producing identical goods in
Q35: Two firms are producing identical goods in
Q36: Consider the following information:<br>Inverse market demand: P
Q37: (Table: Gascolator Producers I) Banner and Sense
Q38: (Table: Gascolator Producers I) Banner and Sense
Q40: The inverse demand for tacos is given
Q41: (Figure: Market Demand Curve I) The graph
Q42: Taggart Express operates in a monopolistically competitive
Q43: Two companies are the only snowplow merchants
Q44: Suppose that two firms are engaged in