Multiple Choice
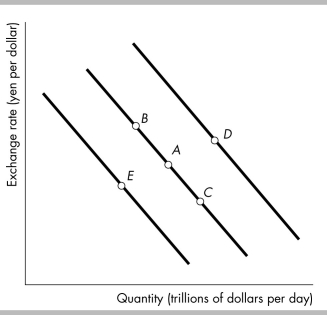
-The above figure shows the demand curve for dollars in the yen/dollar exchange market. A movement from point A to point B means that the
A) quantity supplied of dollars has increased.
B) quantity demanded of dollars has increased.
C) quantity demanded of dollars has decreased.
D) quantity demanded of yen has decreased.
Correct Answer:

Verified
Correct Answer:
Verified
Q16: The account that records foreign investment in
Q17: <img src="https://d2lvgg3v3hfg70.cloudfront.net/TB8586/.jpg" alt=" -Using the table
Q18: In June 2008, $1 bought 104 yen
Q19: Explain the effect on the demand for
Q20: The United States is a creditor nation.
Q22: If people expect the dollar to depreciate,
Q23: <img src="https://d2lvgg3v3hfg70.cloudfront.net/TB8586/.jpg" alt=" -In the figure
Q24: An increase in the Japanese interest rate
Q25: In 2009, Germany's capital account was -$135
Q26: <img src="https://d2lvgg3v3hfg70.cloudfront.net/TB8586/.jpg" alt=" -The citizens of