Multiple Choice
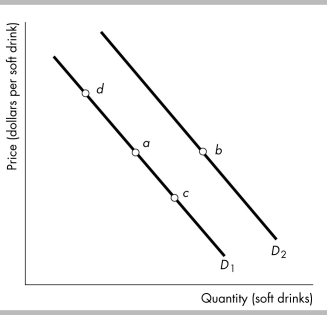
-Consider the demand curves for soft drinks shown in the figure above. A movement from point a to point c represents
A) a decrease in quantity demanded.
B) an increase in demand.
C) an increase in quantity demanded.
D) a decrease in demand.
Correct Answer:

Verified
Correct Answer:
Verified
Q30: The money price of a pizza is
Q31: Explain why a relative price is an
Q32: If a market is NOT in equilibrium,
Q33: <img src="https://d2lvgg3v3hfg70.cloudfront.net/TB8586/.jpg" alt=" -In the figure
Q34: <img src="https://d2lvgg3v3hfg70.cloudfront.net/TB8586/.jpg" alt=" -A market research
Q36: <img src="https://d2lvgg3v3hfg70.cloudfront.net/TB8586/.jpg" alt=" -The figure above
Q37: Sweatshirts and tee-shirts are complements in consumption
Q38: <img src="https://d2lvgg3v3hfg70.cloudfront.net/TB8586/.jpg" alt=" -The above figures
Q39: Which of the following shifts the demand
Q40: When demand increases, the equilibrium price _