Essay
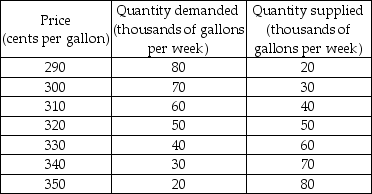
-A market research team has come up with the demand and supply schedules for gasoline in Motorville in the table above. Use these data to analyze the situation in the market for gas in Motorville.
a) Draw a figure showing the demand curve for gasoline and the supply curve of gasoline. What are the equilibrium price and quantity?
b) Suppose the price is $3.30. Describe the situation in the market and explain how the market adjusts. Now suppose the price is $3.00. Describe the situation in the market and explain how the market adjusts.
c) The market research report also predicts that a rise in the price of crude oil will decrease the quantity of gas supplied by 20,000 gallons a week at each price. Suppose the price of crude oil does rise. Use your figure to show how this will affect the market for gas. How will the market adjust? What will be the new equilibrium price and quantity?
Correct Answer:

Verified
 a) See the figure above. The equilibriu...
View Answer
Unlock this answer now
Get Access to more Verified Answers free of charge
Correct Answer:
Verified
View Answer
Unlock this answer now
Get Access to more Verified Answers free of charge
Q68: <img src="https://d2lvgg3v3hfg70.cloudfront.net/TB8586/.jpg" alt=" -The above figures
Q69: Which of the following lists has variables
Q70: A ticket to see the Radio City
Q71: You observe that in the market for
Q72: <img src="https://d2lvgg3v3hfg70.cloudfront.net/TB8586/.jpg" alt=" -The above figures
Q74: <img src="https://d2lvgg3v3hfg70.cloudfront.net/TB8586/.jpg" alt=" -The above table
Q75: <img src="https://d2lvgg3v3hfg70.cloudfront.net/TB8586/.jpg" alt=" -The figure above
Q76: <img src="https://d2lvgg3v3hfg70.cloudfront.net/TB8586/.jpg" alt=" -The above figure
Q77: If macaroni and cheese is an inferior
Q78: The price of a bag of corn