Multiple Choice
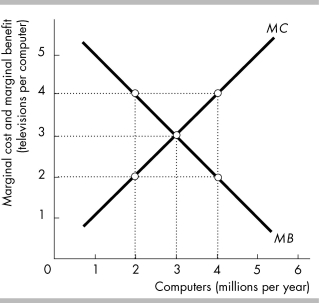
-In the figure above, at the allocatively efficient level of computer production consumers are willing to give up
A) 0 televisions per computer.
B) between 0 and 3 televisions per computer.
C) 3 televisions per computer.
D) more than 3 televisions per computer.
Correct Answer:

Verified
Correct Answer:
Verified
Q407: <img src="https://d2lvgg3v3hfg70.cloudfront.net/TB8586/.jpg" alt=" -The above table
Q408: <img src="https://d2lvgg3v3hfg70.cloudfront.net/TB8586/.jpg" alt=" -Refer to the
Q409: <img src="https://d2lvgg3v3hfg70.cloudfront.net/TB8586/.jpg" alt=" -According to the
Q410: As we increase the production of computers,
Q411: "Allocative efficiency in the production of cherries
Q413: "The United States is more productive in
Q414: The production possibilities frontier is<br>A) upward sloping
Q415: <img src="https://d2lvgg3v3hfg70.cloudfront.net/TB8586/.jpg" alt=" -The table above
Q416: <img src="https://d2lvgg3v3hfg70.cloudfront.net/TB8586/.jpg" alt=" -Based on the
Q417: <img src="https://d2lvgg3v3hfg70.cloudfront.net/TB8586/.jpg" alt=" -The data in