Multiple Choice
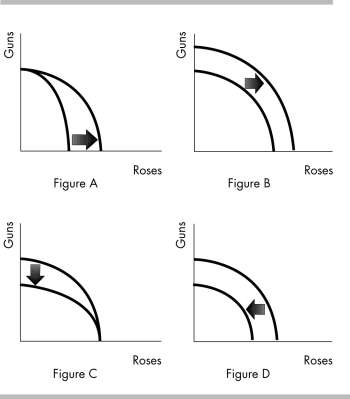
-Based on the above, which figure shows the impact of a decrease in the population available to work?
A) Figure A
B) Figure B
C) Figure C
D) Figure D
Correct Answer:

Verified
Correct Answer:
Verified
Q411: "Allocative efficiency in the production of cherries
Q412: <img src="https://d2lvgg3v3hfg70.cloudfront.net/TB8586/.jpg" alt=" -In the figure
Q413: "The United States is more productive in
Q414: The production possibilities frontier is<br>A) upward sloping
Q415: <img src="https://d2lvgg3v3hfg70.cloudfront.net/TB8586/.jpg" alt=" -The table above
Q417: <img src="https://d2lvgg3v3hfg70.cloudfront.net/TB8586/.jpg" alt=" -The data in
Q418: 4 Economic Growth<br>-An expansion of the production
Q419: When a nation is producing the allocatively
Q420: Economic growth can be pictured in a
Q421: <img src="https://d2lvgg3v3hfg70.cloudfront.net/TB8586/.jpg" alt=" -In the figure