Multiple Choice
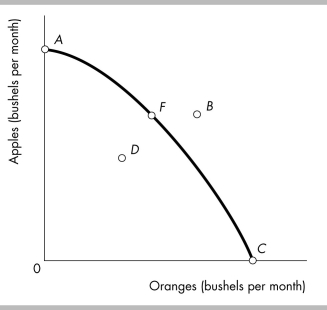
-In the figure above, how can the economy represented by the production possibilities frontier move from point C to point F?
A) Increase the available amount of resources.
B) Increase the level of technology.
C) Redistribute the existing resources to produce more apples and fewer oranges.
D) First move to point B and then move to point F.
Correct Answer:

Verified
Correct Answer:
Verified
Q142: Marginal benefit curves slope _ and marginal
Q143: <img src="https://d2lvgg3v3hfg70.cloudfront.net/TB8586/.jpg" alt=" -If the United
Q144: <img src="https://d2lvgg3v3hfg70.cloudfront.net/TB8586/.jpg" alt=" -In the figure
Q145: If an economy is operating at a
Q146: If the marginal benefit of a good
Q148: <img src="https://d2lvgg3v3hfg70.cloudfront.net/TB8586/.jpg" alt=" -In the figure
Q149: Resource use is allocatively efficient if the<br>A)
Q150: Opportunity cost is illustrated in a production
Q151: Why is it likely that the United
Q152: The production possibilities frontier represents<br>A) the maximum