Multiple Choice
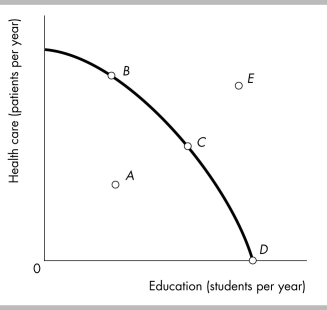
-In the figure above, the opportunity cost of moving from point C to point D is
A) the loss in production in the health care sector.
B) the increase in production in the education sector.
C) zero.
D) the loss in production in the education sector.
Correct Answer:

Verified
Correct Answer:
Verified
Q139: <img src="https://d2lvgg3v3hfg70.cloudfront.net/TB8586/.jpg" alt=" -The above table
Q140: <img src="https://d2lvgg3v3hfg70.cloudfront.net/TB8586/.jpg" alt=" -In the figure
Q141: <img src="https://d2lvgg3v3hfg70.cloudfront.net/TB8586/.jpg" alt=" -The figure above
Q142: Marginal benefit curves slope _ and marginal
Q143: <img src="https://d2lvgg3v3hfg70.cloudfront.net/TB8586/.jpg" alt=" -If the United
Q145: If an economy is operating at a
Q146: If the marginal benefit of a good
Q147: <img src="https://d2lvgg3v3hfg70.cloudfront.net/TB8586/.jpg" alt=" -In the figure
Q148: <img src="https://d2lvgg3v3hfg70.cloudfront.net/TB8586/.jpg" alt=" -In the figure
Q149: Resource use is allocatively efficient if the<br>A)