Multiple Choice
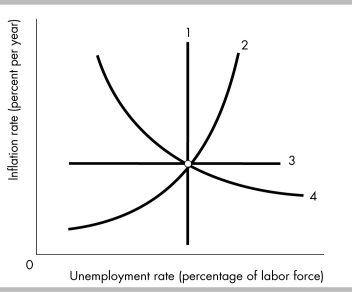
-In the above figure, which of the following curves represents the long-run Phillips curve?
A) 1
B) 2
C) 3
D) 4
Correct Answer:

Verified
Correct Answer:
Verified
Related Questions
Q75: At the start of a cost-push inflation<br>A)
Q76: Critics of the real business cycle theory
Q77: <img src="https://d2lvgg3v3hfg70.cloudfront.net/TB8586/.jpg" alt=" -In the above
Q78: Real business cycle theory says that the
Q79: <img src="https://d2lvgg3v3hfg70.cloudfront.net/TB8586/.jpg" alt=" -The figure above
Q81: During an unanticipated deflation, the real wage
Q82: <img src="https://d2lvgg3v3hfg70.cloudfront.net/TB8586/.jpg" alt=" -The figure above
Q83: The real business cycle (RBC) theory argues
Q84: The theory that regards random fluctuations in
Q85: Which of the following is the factor