Essay
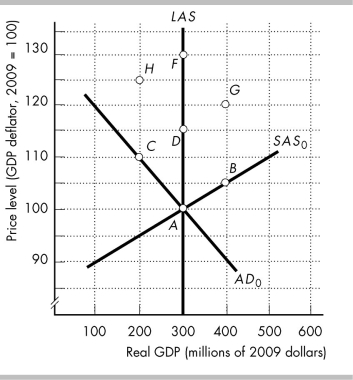
-The figure above shows the initial aggregate demand curve, AD0, the initial short-run aggregate supply curve, SAS0, and the long-run aggregate supply curve, LAS. The points in the figure show possible combinations of real GDP and the price level at which the economy of Atlantia is in macroeconomic equilibrium. The economy is initially at point A. Then, the government increases its expenditure on goods and services. Draw the new aggregate demand and short-run aggregate supply curves in the figure to show the effects of this event on Atlantia's real GDP and price level.
a) What happens to Atlantia's potential GDP?
b) In the short run, what happens to aggregate supply and aggregate demand?
c) What are the new short-run equilibrium real GDP and price level?
d) In the long run, what happens to the short-run aggregate supply and aggregate demand?
e) What are the new long-run equilibrium real GDP and price level?
Correct Answer:

Verified
a) Atlantia's potential GDP is not affec...View Answer
Unlock this answer now
Get Access to more Verified Answers free of charge
Correct Answer:
Verified
View Answer
Unlock this answer now
Get Access to more Verified Answers free of charge
Q74: In the short run, an unexpected increase
Q75: At the start of a cost-push inflation<br>A)
Q76: Critics of the real business cycle theory
Q77: <img src="https://d2lvgg3v3hfg70.cloudfront.net/TB8586/.jpg" alt=" -In the above
Q78: Real business cycle theory says that the
Q80: <img src="https://d2lvgg3v3hfg70.cloudfront.net/TB8586/.jpg" alt=" -In the above
Q81: During an unanticipated deflation, the real wage
Q82: <img src="https://d2lvgg3v3hfg70.cloudfront.net/TB8586/.jpg" alt=" -The figure above
Q83: The real business cycle (RBC) theory argues
Q84: The theory that regards random fluctuations in