Multiple Choice
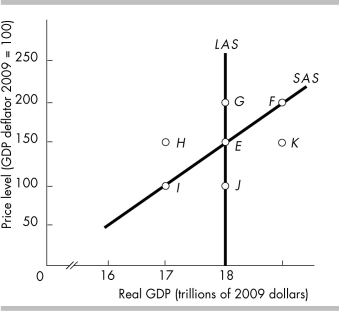
-In the above figure, which movement illustrates the impact of a falling price level and a constant money wage rate?
A) E to I
B) E to F
C) E to J
D) E to H
Correct Answer:

Verified
Correct Answer:
Verified
Q76: <img src="https://d2lvgg3v3hfg70.cloudfront.net/TB8586/.jpg" alt=" -The curve labeled
Q77: Which of the following shifts the aggregate
Q78: Which of the following events shifts the
Q79: According to the intertemporal substitution effect, when
Q80: Give examples of factors that decrease aggregate
Q82: <img src="https://d2lvgg3v3hfg70.cloudfront.net/TB8586/.jpg" alt=" -In the above
Q83: An individual holds $10,000 in a checking
Q84: <img src="https://d2lvgg3v3hfg70.cloudfront.net/TB8586/.jpg" alt=" -In the above
Q85: Suppose there is a temporary increase in
Q86: <img src="https://d2lvgg3v3hfg70.cloudfront.net/TB8586/.jpg" alt=" -Suppose the economy