Multiple Choice
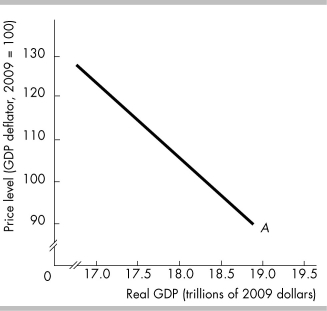
-The curve labeled A in the above figure is
A) a short-run aggregate supply curve.
B) an aggregate demand curve.
C) a long-run aggregate supply curve.
D) a production possibilities curve.
Correct Answer:

Verified
Correct Answer:
Verified
Q71: The aggregate demand curve shows<br>A) total expenditures
Q72: In the short-run macroeconomic equilibrium<br>A) real GDP
Q73: <img src="https://d2lvgg3v3hfg70.cloudfront.net/TB8586/.jpg" alt=" -In the above
Q74: When the economy is at an above-full-employment
Q75: <img src="https://d2lvgg3v3hfg70.cloudfront.net/TB8586/.jpg" alt=" -In the above
Q77: Which of the following shifts the aggregate
Q78: Which of the following events shifts the
Q79: According to the intertemporal substitution effect, when
Q80: Give examples of factors that decrease aggregate
Q81: <img src="https://d2lvgg3v3hfg70.cloudfront.net/TB8586/.jpg" alt=" -In the above