Multiple Choice
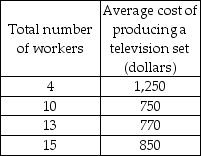
-Graphing the data in the above table with the number of workers on the horizontal axis and the average cost on the vertical axis, the graph would show
A) first a negative and then a positive relationship.
B) a horizontal line.
C) no relationship.
D) a linear relationship.
Correct Answer:

Verified
Correct Answer:
Verified
Q14: Suppose we are considering the relationship between
Q15: The loss of the highest-valued alternative defines
Q16: From 8 P.M. to 10 P.M., Susan
Q17: When graphed, variables that are unrelated are
Q18: What is the difference between microeconomics and
Q20: <img src="https://d2lvgg3v3hfg70.cloudfront.net/TB8586/.jpg" alt=" -In the above
Q21: Which of the following is a microeconomic
Q22: If two variables are unrelated, a scatter
Q23: Factors of production include all of the
Q24: <img src="https://d2lvgg3v3hfg70.cloudfront.net/TB8586/.jpg" alt=" -In the above