Multiple Choice
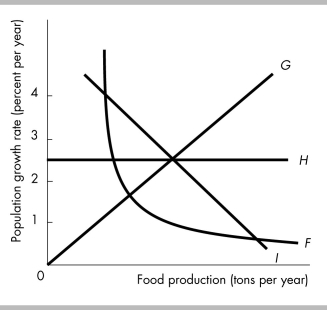
-In the above figure, which curve indicates that the level of food production does not affect the population growth rate?
A) F
B) G
C) H
D) I
Correct Answer:

Verified
Correct Answer:
Verified
Related Questions
Q375: A positive statement is<br>A) about what ought
Q376: <img src="https://d2lvgg3v3hfg70.cloudfront.net/TB8586/.jpg" alt=" -In the above
Q377: Normative economic statements<br>A) describe what ought to
Q378: If the quantity of wood purchased decreases
Q379: A graph shows the price of a
Q381: If a curve rises and then falls,
Q382: Define marginal cost and marginal benefit.
Q383: <img src="https://d2lvgg3v3hfg70.cloudfront.net/TB8586/.jpg" alt=" -The slope of
Q384: "As interest rates rise, people save more
Q385: A scatter diagram plots the value of