Multiple Choice
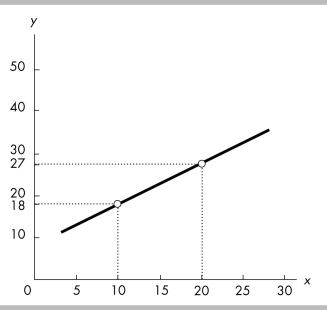
-The slope of the line shown in the above figure is
A) 0.90.
B) 1.5.
C) 1.11.
D) 2.
Correct Answer:

Verified
Correct Answer:
Verified
Related Questions
Q378: If the quantity of wood purchased decreases
Q379: A graph shows the price of a
Q380: <img src="https://d2lvgg3v3hfg70.cloudfront.net/TB8586/.jpg" alt=" -In the above
Q381: If a curve rises and then falls,
Q382: Define marginal cost and marginal benefit.
Q384: "As interest rates rise, people save more
Q385: A scatter diagram plots the value of
Q386: <img src="https://d2lvgg3v3hfg70.cloudfront.net/TB8586/.jpg" alt=" -Graph
Q387: Which of the following is an example
Q388: If the change in the y-axis variable