Multiple Choice
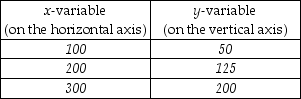
-The above table shows data on two variables. If these data were graphed, the slope of the line would be
A) 1/2.
B) 4/3.
C) 2/3.
D) 3/4.
Correct Answer:

Verified
Correct Answer:
Verified
Related Questions
Q51: Which of the following is a positive
Q52: <img src="https://d2lvgg3v3hfg70.cloudfront.net/TB8586/.jpg" alt=" -In the above
Q53: One economist says that raising taxes on
Q54: Which of the following are considered factors
Q55: Positive and normative statements differ in that<br>A)
Q57: To graph a relationship among several variables,
Q58: The income earned by the people who
Q59: Which of the following is a positive
Q60: <img src="https://d2lvgg3v3hfg70.cloudfront.net/TB8586/.jpg" alt=" -Using the data
Q61: The United States produces more services than