Multiple Choice
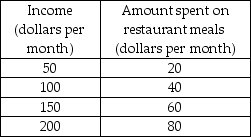
-Using the data in the above table, if income is on the x-axis and the amount spent on restaurant meals is on the y-axis, the graph of the two variables would be
A) upward sloping.
B) downward sloping.
C) vertical.
D) horizontal.
Correct Answer:

Verified
Correct Answer:
Verified
Q55: Positive and normative statements differ in that<br>A)
Q56: <img src="https://d2lvgg3v3hfg70.cloudfront.net/TB8586/.jpg" alt=" -The above table
Q57: To graph a relationship among several variables,
Q58: The income earned by the people who
Q59: Which of the following is a positive
Q61: The United States produces more services than
Q63: Which of the following is a positive
Q64: Mark Zuckerberg believes everyone in the world
Q65: The fact that wants cannot be fully
Q376: <img src="https://d2lvgg3v3hfg70.cloudfront.net/TB8586/.jpg" alt=" -In the above