Multiple Choice
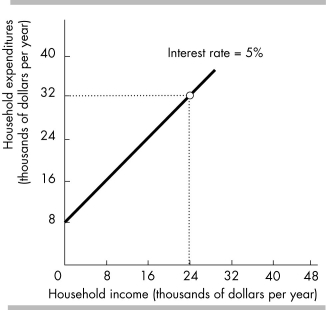
-The slope of the line in the above figure is
A) -4.
B) -2.5.
C) -1.0.
D) 1.0.
Correct Answer:

Verified
Correct Answer:
Verified
Related Questions
Q87: Along a straight line, the value of
Q88: <img src="https://d2lvgg3v3hfg70.cloudfront.net/TB8586/.jpg" alt=" -The relationship between
Q89: <img src="https://d2lvgg3v3hfg70.cloudfront.net/TB8586/.jpg" alt=" -In the above
Q90: What do economists mean when they discuss
Q91: Human resources that perform the functions of
Q93: Suppose you are working four nights per
Q94: A diagram shows the quantity of tomatoes
Q95: The variable measured on the y-axis increases
Q96: Which of the following is a macroeconomic
Q97: Whenever one variable increases, another variable decreases.