Multiple Choice
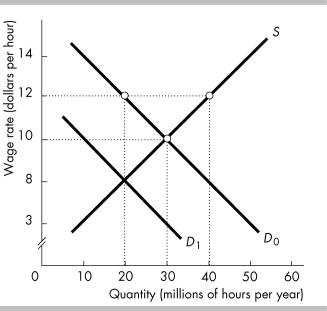
-In the figure above, D0 is the demand for labor curve. Imposing a minimum wage of $12 per hour will initially
A) increase employment from 20 to 40 million hours per year.
B) increase employment from 30 to 40 million hours per year.
C) decrease employment from 40 to 20 million hours per year.
D) decrease employment from 30 to 20 million hours per year.
Correct Answer:

Verified
Correct Answer:
Verified
Q193: <img src="https://d2lvgg3v3hfg70.cloudfront.net/TB8586/.jpg" alt=" -To help pay
Q194: <img src="https://d2lvgg3v3hfg70.cloudfront.net/TB8586/.jpg" alt=" -In the figure
Q195: <img src="https://d2lvgg3v3hfg70.cloudfront.net/TB8586/.jpg" alt=" -The table above
Q196: We know that the minimum wage causes
Q197: Suppose penalties are imposed on both buyers
Q199: How is the incidence of a sales
Q200: In general, a fine on smoking cigarettes
Q201: Which of the following statements is TRUE
Q202: The more elastic the demand for a
Q203: <img src="https://d2lvgg3v3hfg70.cloudfront.net/TB8586/.jpg" alt=" -The figure shows