Essay
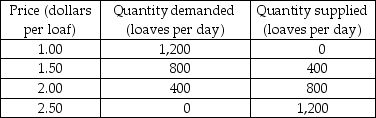
-The table above gives the demand and supply schedules for bread in Bakerville. Draw the demand and supply curves. Suppose a subsidy on bread of $1 per loaf is given to bread producers.
a) How will the subsidy affect the price paid by buyers for a loaf of bread and the quantity of bread sold? Show your work on your graph.
b) How will the subsidy affect the amount sellers receive for a loaf of bread?
c) After the subsidy is granted, what is the marginal social cost of the last loaf of bread produced? What is its marginal social benefit? If there are no external costs or external benefits, is the bread market efficient once the subsidy is granted?
Correct Answer:

Verified
 a) The figure above shows the bread mar...
View Answer
Unlock this answer now
Get Access to more Verified Answers free of charge
Correct Answer:
Verified
View Answer
Unlock this answer now
Get Access to more Verified Answers free of charge
Q190: <img src="https://d2lvgg3v3hfg70.cloudfront.net/TB8586/.jpg" alt=" -The market for
Q191: <img src="https://d2lvgg3v3hfg70.cloudfront.net/TB8586/.jpg" alt=" -The above figure
Q192: A production quota on tobacco lowers the
Q193: <img src="https://d2lvgg3v3hfg70.cloudfront.net/TB8586/.jpg" alt=" -To help pay
Q194: <img src="https://d2lvgg3v3hfg70.cloudfront.net/TB8586/.jpg" alt=" -In the figure
Q196: We know that the minimum wage causes
Q197: Suppose penalties are imposed on both buyers
Q198: <img src="https://d2lvgg3v3hfg70.cloudfront.net/TB8586/.jpg" alt=" -In the figure
Q199: How is the incidence of a sales
Q200: In general, a fine on smoking cigarettes