Multiple Choice

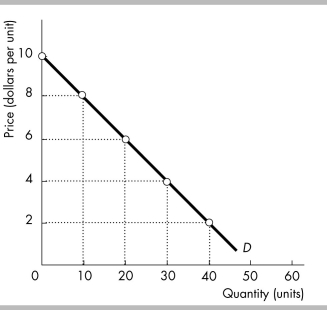
-The figure above illustrates a linear demand curve. In the range from $8 to $6
A) the demand is price elastic.
B) the demand is unit elastic.
C) the demand is price inelastic.
D) more information is needed to determine if the demand is price elastic, unit elastic, or inelastic.
Correct Answer:

Verified
Correct Answer:
Verified
Q242: <img src="https://d2lvgg3v3hfg70.cloudfront.net/TB8586/.jpg" alt=" -The figure above
Q243: In 1973 and again in 1979, the
Q244: The price elasticity of demand can range
Q245: <img src="https://d2lvgg3v3hfg70.cloudfront.net/TB8586/.jpg" alt=" -The increase in
Q246: "Last October, due to an early frost,
Q248: A straight-line demand curve with negative slope
Q249: If the price of a soda increases
Q250: Redbox rents DVDs for $1 per day
Q251: The income elasticity of demand for food<br>A)
Q252: <img src="https://d2lvgg3v3hfg70.cloudfront.net/TB8586/.jpg" alt=" -The table above