Multiple Choice
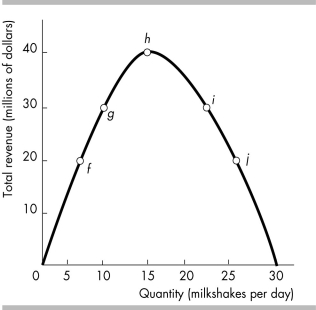
-The figure above represents the behavior of total revenue as price falls along a straight-line demand curve. Unit elasticity of demand occurs at
A) point g.
B) point h.
C) point i.
D) point j.
Correct Answer:

Verified
Correct Answer:
Verified
Q237: The greater the magnitude of the absolute
Q238: <img src="https://d2lvgg3v3hfg70.cloudfront.net/TB8586/.jpg" alt=" -The demand curve
Q239: Aglets are the metal or plastic tips
Q240: If the demand for KFC chicken is
Q241: If the cross elasticity of demand for
Q243: In 1973 and again in 1979, the
Q244: The price elasticity of demand can range
Q245: <img src="https://d2lvgg3v3hfg70.cloudfront.net/TB8586/.jpg" alt=" -The increase in
Q246: "Last October, due to an early frost,
Q247: <img src="https://d2lvgg3v3hfg70.cloudfront.net/TB8586/.jpg" alt=" -The figure above