Multiple Choice
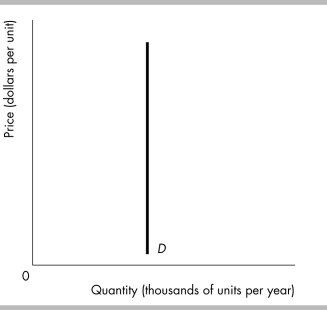
-The above figure illustrates the demand curve for a good. The good has
A) no substitutes.
B) only one substitute.
C) only a few substitutes.
D) many substitutes.
Correct Answer:

Verified
Correct Answer:
Verified
Related Questions
Q364: If at a given moment, no matter
Q365: The greater the substitutability between Northwest timber
Q366: The price elasticity of demand measures<br>A) how
Q367: Price elasticity of demand is a units-free
Q368: Suppose inter-city bus travel is a substitute
Q370: If the total revenue received by sellers
Q371: The taxicab fare in Newville is regulated.
Q372: If the cross elasticity of demand between
Q373: In the summer 2012 the lobster catch
Q374: <img src="https://d2lvgg3v3hfg70.cloudfront.net/TB8586/.jpg" alt=" -The increase in