Multiple Choice
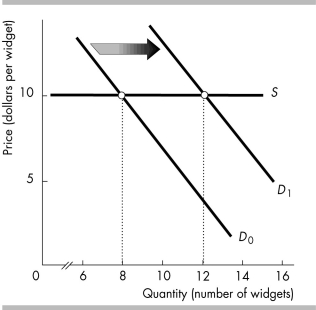
-The increase in the demand for widgets, shown in the figure above, is the result of a decrease in the price of McBoover devices from $11 to $9. Therefore, the cross-price elasticity for these two products is
A) -2.0.
B) -0.5.
C) 0.5.
D) 2.0.
Correct Answer:

Verified
Correct Answer:
Verified
Q369: <img src="https://d2lvgg3v3hfg70.cloudfront.net/TB8586/.jpg" alt=" -The above figure
Q370: If the total revenue received by sellers
Q371: The taxicab fare in Newville is regulated.
Q372: If the cross elasticity of demand between
Q373: In the summer 2012 the lobster catch
Q375: If tea and coffee are substitutes, the
Q376: If the owner of a local movie
Q377: An important determinant of the price elasticity
Q378: If the price of a magazine increases
Q379: The price elasticity of demand equals magnitude