Multiple Choice
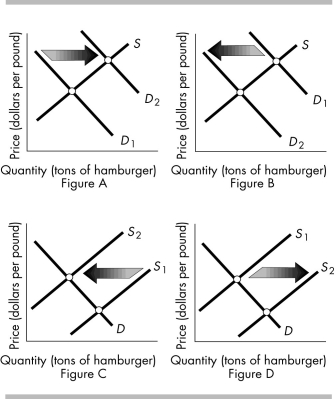
-The above figures show the market for hamburger meat. Which figure(s) shows the effect of an increase in the number of people who eat hamburger meat?
A) Figure A
B) Figure B
C) Figure C
D) Figures A and C
Correct Answer:

Verified
Correct Answer:
Verified
Q210: <img src="https://d2lvgg3v3hfg70.cloudfront.net/TB8586/.jpg" alt=" -In the above
Q211: What leads to a decrease in the
Q212: We observe that the equilibrium price of
Q213: If consumers' incomes increase and the demand
Q214: You notice that the price and quantity
Q216: A change in the price of a
Q217: What will happen to the equilibrium price
Q218: <img src="https://d2lvgg3v3hfg70.cloudfront.net/TB8586/.jpg" alt=" -Consider the demand
Q219: In 2015, the price of peanuts was
Q220: <img src="https://d2lvgg3v3hfg70.cloudfront.net/TB8586/.jpg" alt=" -In the above